Equity Overview
MARKETS HANG TEN ON WAVE OF TARIFF HEADLINES
The S&P 500 endured some choppy surf on its way to producing gains of 10% during the quarter. Q2 began with a continuation of the eventual 20% market decline started by tariff headlines in late February. However, deescalating trade tensions and resilient corporate earnings caused tremendous rallies in the months of May and June. Reemerging AI growth catalysts caused tech stocks to resume their leadership which led to subdued returns for equal-weight, mid-cap, and small cap indices.
‘TACO TRADE’ IS MORE APPETIZING THAN ‘LIBERATION DAY’
On April 2, President Trump announced tariffs on nearly all US imports causing a 2-day 10% decline in the S&P. A week later, a 90-day pause on those same tariffs were issued giving rise to the tongue-in-cheek notion that Trump Always Chickens Out when it comes to holding hard stances that could adversely affect stocks. With renewed faith that the president will always act in the best interest of the market, investors piled into stocks powering the S&P back to all-time highs in late June.
FED FENDS OFF EXTERNAL AND INTERNAL RATE CUT PRESSURES
Fed Chair Jerome Powell endured drama from multiple ends in Q2. Powell defended the Fed’s approach of waiting for more data on the potentially inflationary effects of tariffs. President Trump publicly disagreed with the chair’s stance and suggested that replacing Powell was a top priority. Dissenting opinions were also present within the Fed Board as some members stated their desire for rate cuts as soon as July.
A BIG BEAUTIFUL BILL AND A BRIEF UGLY CONFLICT
Q2 was defined primarily by trade-policy shocks but progress in domestic and foreign policy also helped the market march higher. The budget reconciliation proposal known as the “Big Beautiful Bill” put attention back on solidifying the 2017 tax cuts – a policy measure that helped ignite the post-election Trump rally in 2024. Surprise bombings between Israel and Iran caused brief spikes in oil and defense stocks but had limited sustained impact as tensions quickly de-escalated.
Market Outlook
NEW ALL-TIME HIGHS POSSIBLE IF OTHER HISTORICAL HIGHS FALL
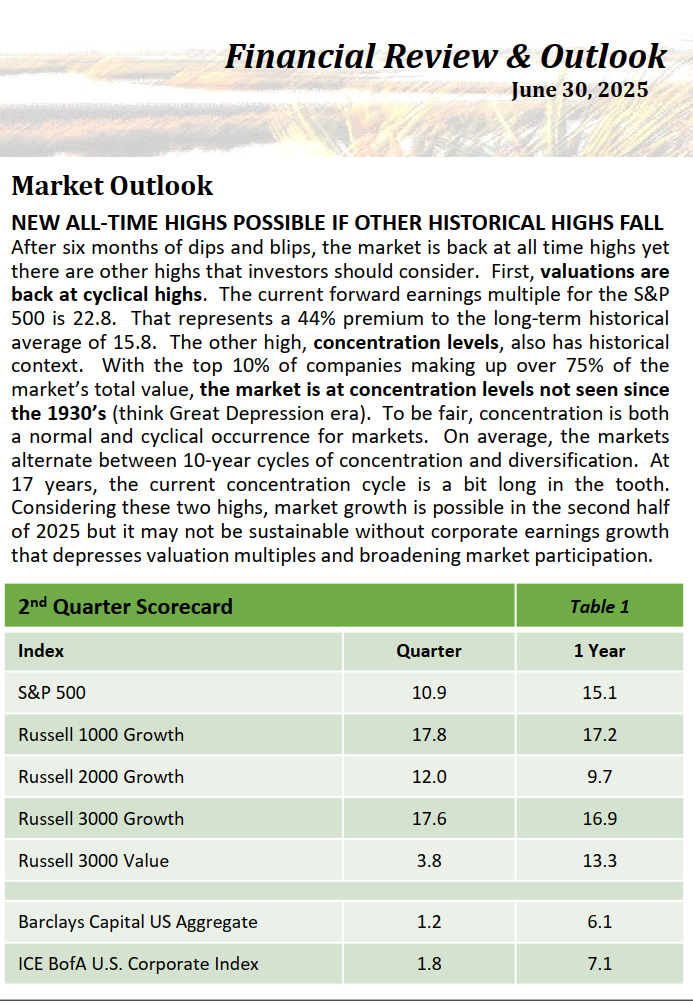
After six months of dips and blips, the market is back at all time highs yet there are other highs that investors should consider. First, valuations are back at cyclical highs. The current forward earnings multiple for the S&P 500 is 22.8. That represents a 44% premium to the long-term historical average of 15.8. The other high, concentration levels, also has historical context. With the top 10% of companies making up over 75% of the market’s total value, the market is at concentration levels not seen since the 1930’s (think Great Depression era). To be fair, concentration is both a normal and cyclical occurrence for markets. On average, the markets alternate between 10-year cycles of concentration and diversification. At 17 years, the current concentration cycle is a bit long in the tooth. Considering these two highs, market growth is possible in the second half of 2025 but it may not be sustainable without corporate earnings growth that depresses valuation multiples and broadening market participation

Fixed Income Overview
YIELD OF DREAMS
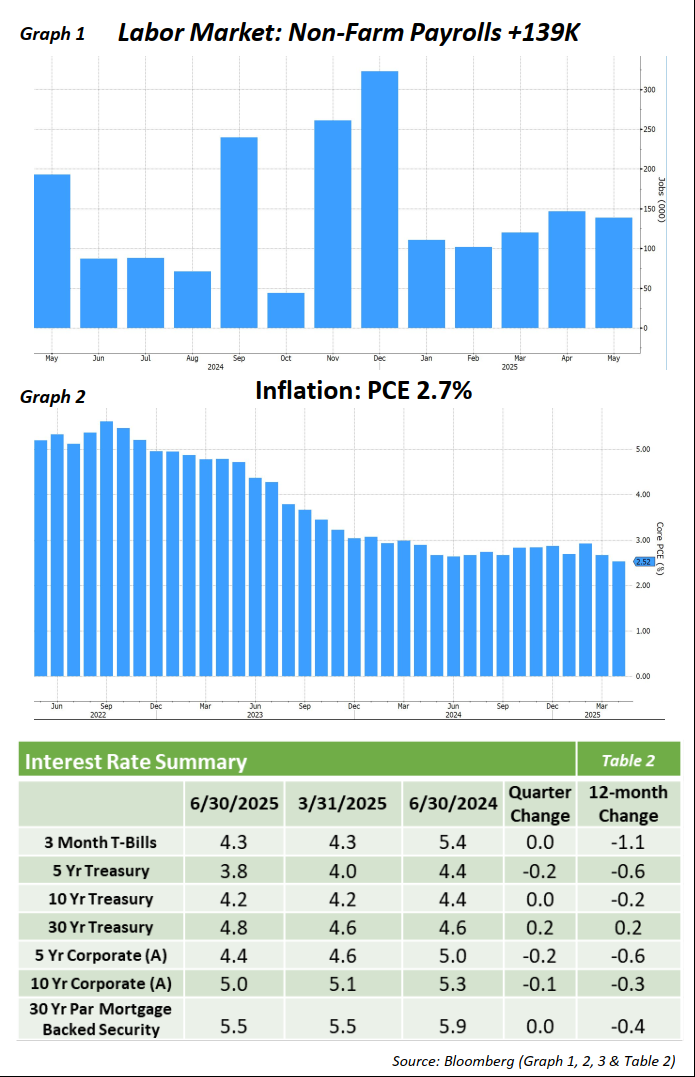
The 2nd quarter was an eventful one in terms of events that were able to move the bond market in all directions. The drafting of a new tax bill, Moody’s downgrading U.S. debt, tariff volatility, and the Israel/Iran conflict were just some of those events that had an impact. In the end, concerns about extreme policy uncertainty, inflation and longterm debt sustainability were paramount and the U.S. Treasury curve steepened with front-end rates rallying and long-end rates underperforming during the quarter.
This back-and-forth in the market materialized in the performance. Despite intraquarter volatility, the Bloomberg Aggregate was up moderately with a return of +1.21%.
Since the Treasury curve began to normalize in Q4 2024, there has been a steady trend of curve steepening as the longer part of the curve sold off more than the front-end as the interest rate term premium increased further due to policy uncertainty. With a spiraling deficit, further exacerbated potentially with the tax bill proposal, the demand for long Treasuries was put into question. The long bond sell-off led to higher yield 30- year by 20bp. Front-end rates rallied with the 5-year ending lower by 15bp as the market increased the implied number of Fed rate cuts due to the softening of economic growth indicators.
A solid labor market (graph 1) and persistent inflation (graph 2) also played a role in keeping the long end yields elevated. In the face of pressure from the President and members of his cabinet, Fed Chairman Powell has remained resolute that cuts to the Fed Funds rate will not occur until there are signs of economic weakness and/or ebbing inflation. The number of expected cuts in 2025 did move throughout the quarter but the most recent expectation is for 2 cuts before the end of the year.
Much like other risk assets, investment grade corporate bonds rallied amidst all the uncertainty. For the quarter, IG spreads tightened by 11bps. Strong earnings and company balance sheets, as well as the appeal of higher yields, was enough to incentivize investors and allow them to look past the potential impact that many of the recent developments may have.
With a YTM of 4.51% on the Bloomberg Aggregate, fixed income still presents as an attractive asset class on a risk/reward basis. Given the ongoing uncertainties however, the ability to remain high-quality and nimble remains an extremely important factor for investors to best navigate the volatility.
Opinions expressed herein are subject to change.

